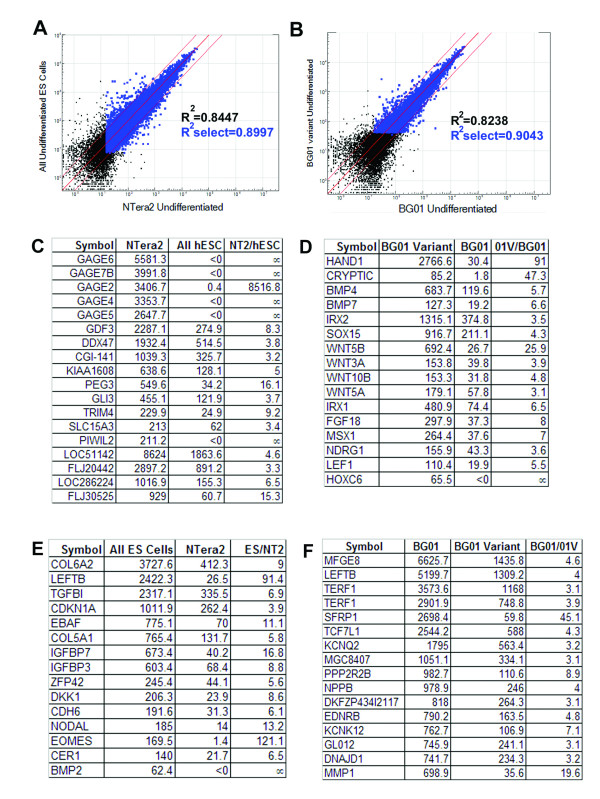
Figure 6.
Diploid pluripotent EC cell line NTera2 and karyotypically abnormal hESC line BG01V can be distinguished from normal hESCs using Illumina array. Comparison of NTera2 and pooled hESC sample resulted a correlation coefficient of 0.8997. Two lists of genes, which were specifically expressed in NTera2 (C) or in hESCs (E) were identified. Likewise, while sharing similarities with BG01 (B, correlation coefficient= 0.9043), BG01V was different from BG01 in expression for many genes, particularly genes from the TGFβ pathway (D, F). Black dots represent genes that were detected at >0 expression level, blue dots represent genes that were detected both at > 0 expression level and at >0.99 confidence. Genes plotted outside the two thin red lines were detected at >2.5- fold difference.

