
Figure 6.
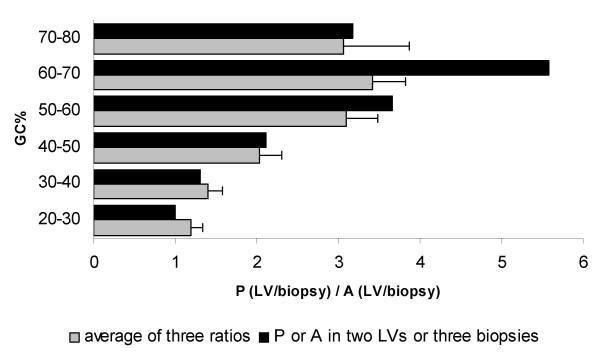
Ratio between present calls (heart/biopsy) and absent calls (heart/biopsy) calculated for the different GC%. GC% was subdivided in groups of 10%. Grey bars indicate the average ( ± SEM) of the three comparisons between parental LVs and LV biopsies; black bars represent the ratio of detection calls when the two parental LVs or all three LV biopsies have the same detection call.