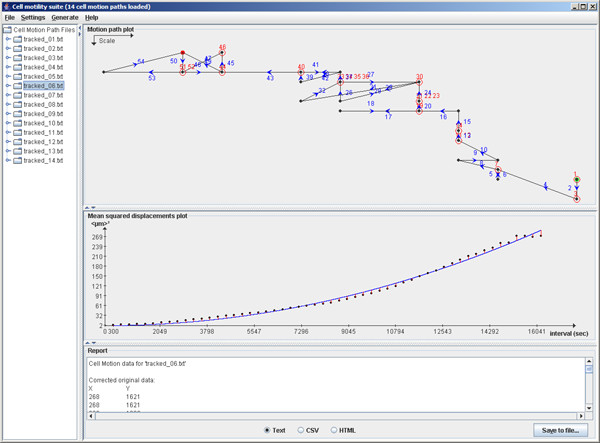
Figure 1.

Screenshot of the cell_motility application. This screenshot of the application shows the tree-view of the data files on the left, and the three analysis panels on the right. These are (from top to bottom): motion path plot, curve fitting chart and text report.
