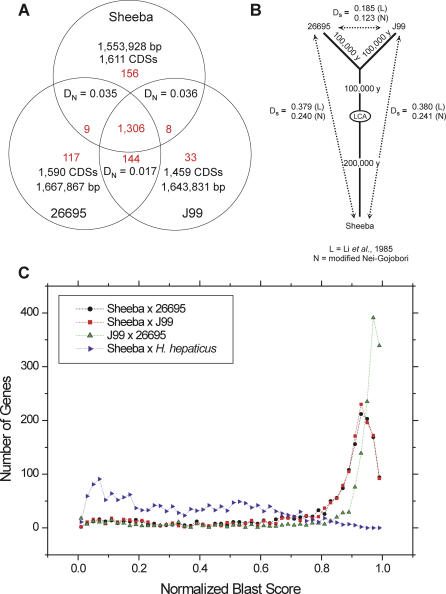
Figure 2. Similarities between the Genomes of H. acinonychis Sheeba and H. pylori 26695 and J99.
(A) Venn diagram of genomic properties. Numbers in red within each arc represent numbers of genes, each of which may contain multiple CDSs if the corresponding gene is fragmented.
(B) Age calculations since a common ancestor (LCA) based on synonymous pair-wise distances for 612 conserved genes according to the methods of Li et al., 1985 and the modified Nei-Gojobori method.
(C) Frequencies of normalized blast scores in pair-wise comparisons between Sheeba and three other genomes.

