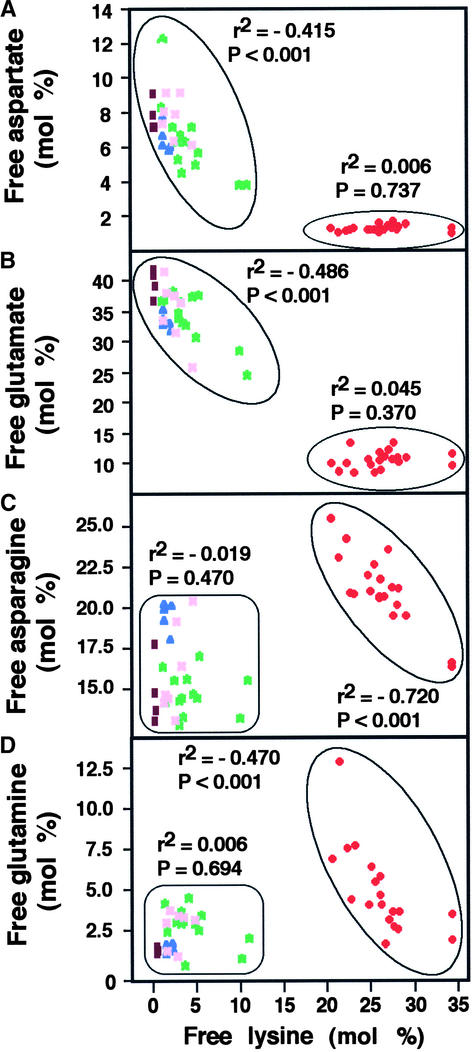
Figure 5.
Correlation between Free Lys and Free Asp, Glu, Asn, or Gln in Wild-Type and Different Transgenic Arabidopsis Plants.
Pearson's correlations between free Lys and each of the other four free amino acids indicated above are given in (A) to (D), respectively. The two distinct populations, designated group 1 and group 2, are circled at left and right, respectively. Numerals near each population represent r2 values of linear regressions followed by significance levels (P). Colored spots represent the following genotypes: brown, wild type; blue, LKR/SDH knockout; pink and green, transgenic plants expressing the phaseolin-DHPS construct in heterozygous and homozygous states, respectively; red, LKR/SDH knockout × phaseolin-DHPS.

