Figure 6.
Modulation of Alternative Splicing in the atSRp30 Transcript in PK12:HA Plants.
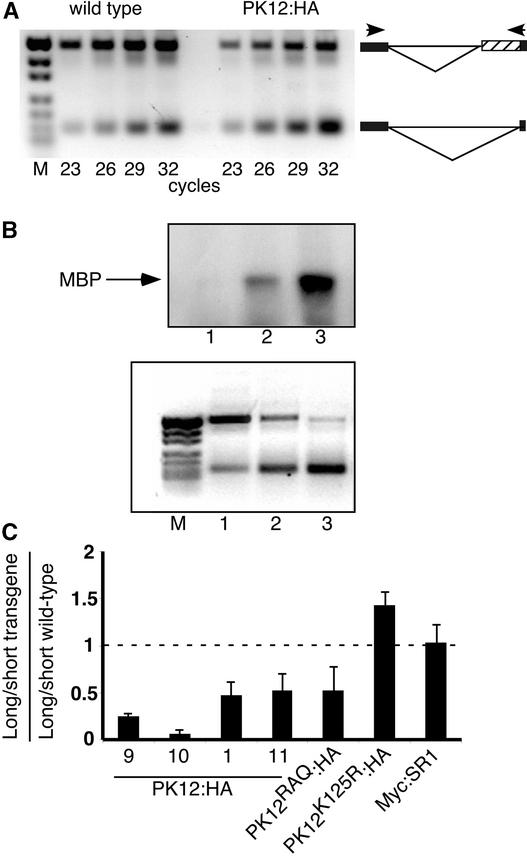
(A) Quantitative RT-PCR analysis of two spliced variants in the atSRp30 transcript. PCR products were fractionated on an ethidium bromide–stained agarose gel. The reaction was performed on first-strand cDNA generated from total RNA extracted from wild-type and PK12:HA plants (line 1). The PCR cycle was terminated at the cycle number indicated to determine the linear range common to the two alternatively spliced forms. Schemes of the alternatively spliced forms are shown at right. The boxes indicate exons flanking the 10th intron. The hatched box represents the intron fragment that resulted from the use of the 3′ alternative splice site. Primers flanking the alternatively spliced intron are shown as arrowheads. M, molecular mass markers.
(B) In vitro kinase assay and RT-PCR analysis of wild-type (lane 1), low-expressing PK12:HA (lane 2), and high-expressing PK12:HA (lane 3) plants. Top gel, total protein extract was subjected to immunoprecipitation with anti-HA antibodies. The immunoprecipitate then was used in an in vitro kinase assay with MBP as a substrate. Bottom gel, RT-PCR analysis of the atSRp30 transcript was performed on transcripts from the same lines used in the top gel. M, molecular mass markers.
(C) Quantification of alternatively spliced long and short forms of atSRp30 in wild-type and transgenic plants. The PK12:HA lines are as indicated. The ratio ± sd of long to short transcript was calculated in different transgenic plants (for details, see Methods). The resulting value then was divided by the value obtained from the same calculation performed for wild-type plants grown under the same conditions. A ratio of 1 (represented by a dashed line) indicates no change in alternative splicing between wild-type and transgenic plants. The results are representative of at least three independent experiments.

