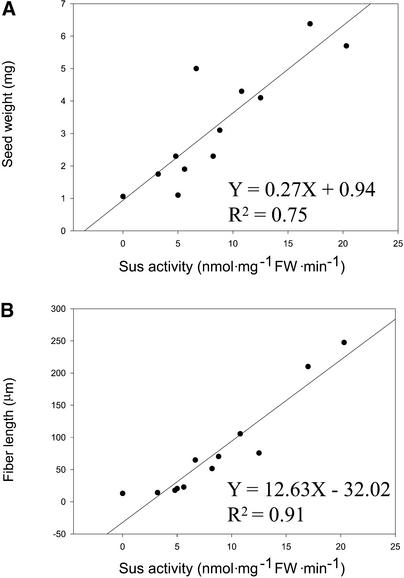
Figure 6.
Regression Correlation between the Suppression of Sus Activity in Ovules at 0 DAA and the Reduction of Seed Weight and Fiber Length at 3 DAA among Wild-Type and 11 Sus-Suppressed Transgenic Individuals.
Each value is the mean of at least six replicates. FW, fresh weight.
(A) Seed weight.
(B) Fiber length.

