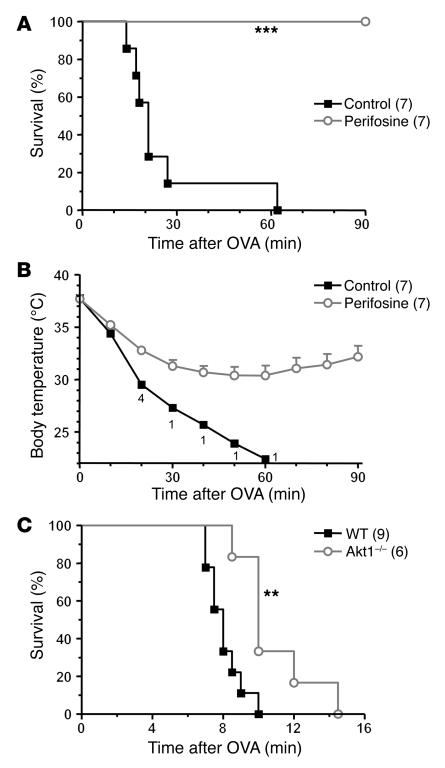
Figure 5. OVA anaphylactic shock in WT and Akt1–/– mice.
(A) Survival plot of C57BL/6 mice sensitized with OVA, pretreated with vehicle (controls) or perifosine, and challenged 19 days later with OVA in 1% EB. The total number of mice in each experimental group is shown in parentheses. ***P = 0.0002. (B) Temperature plot (mean ± SD) of mice sensitized by OVA and challenged 19 days later with OVA in 1% EB. The total number of mice is shown in parentheses, and numbers below the time points indicate the number of mice still alive at the indicated times. (C) Survival plot of WT and Akt1–/– mice, sensitized with OVA and challenged 20 days later with OVA in 1% EB. The total number of mice is shown in brackets in the legend. **P = 0.0043.

