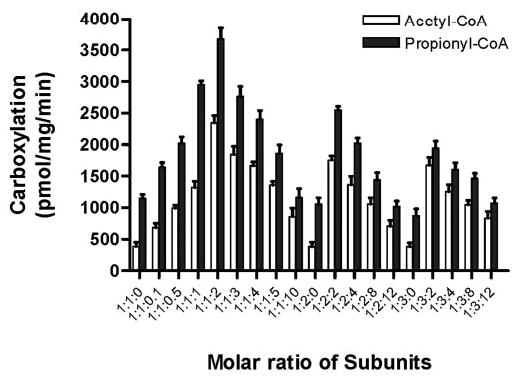
FIGURE 5. Determination of optimal stoichiometry for reconstitution of acyl-CoA carboxylase activity.

Purified subunits were mixed in the indicated ratios prior to concentration. The molar ratios of subunits are indicated as A:B:C where A represents the ratio of the α3-subunit, B represents the ratio of the β5-subunit, and C represents the ratio of the ε-subunit. Acyl-CoA carboxylase activity with acetyl-CoA (white bars) and propionyl-CoA (black bars) substrates were measured after concentration. Results presented are the average of at least three independent experiments with a standard error.
