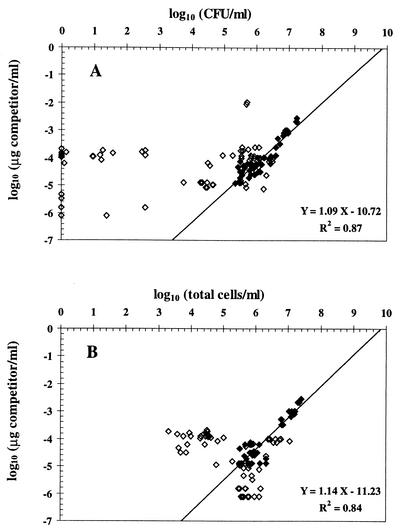
FIG. 2.
Effect of stress on the relationship between QC-PCR results and the number of CFU (A) and total cells (B) of P. fluorescens CHA0. The result of QC-PCR is represented by the concentration of competitor oligonucleotide needed to yield the same amount of amplification product as the corresponding target bacterial DNA in the reaction. ◊, data obtained with stressed cells; ⧫, data derived from log or stationary-phase cells (i.e., control). CFU are arbitrarily plotted as zero when below the detection limit (0.92 log CFU/ml). For CFU and for total cells, statistically significant positive correlations with QC-PCR results were found when log and stationary-phase cells were considered, and regression parameters are thus indicated.

