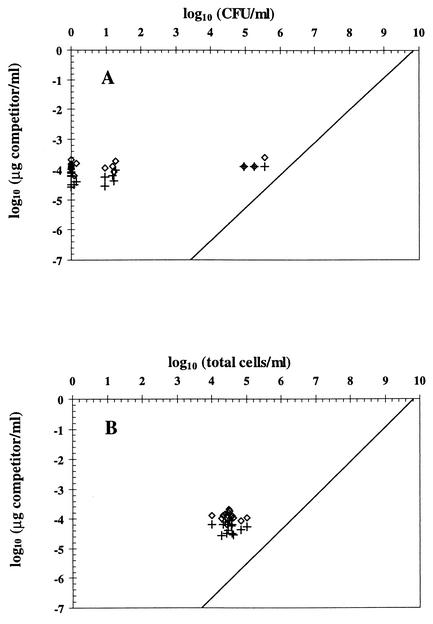
FIG. 3.
Contribution of extracellular DNA to QC-PCR results and comparison of the latter with the numbers of CFU (A) and total cells (B) of P. fluorescens CHA0 exposed to CuSO4 stress (18 samples). In each case, half the sample was digested with Sau3AI to eliminate extracellular DNA (+), whereas the other half was not digested (⋄). CFU are arbitrarily plotted as zero when below the detection limit (0.92 log CFU/ml). The line of best fit for control samples obtained for Fig. 2 is also represented.

