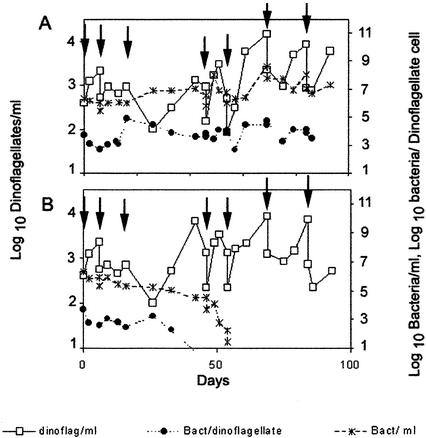
FIG. 1.
Growth of A. catenella and bacteria in batch cultures after successive washing (A) and after successive washing and antibiotic treatments (B). Dinoflagellate and bacterial cells were determined by direct and epifluorescence microscopy, respectively. Dinoflagellate cell concentration (□), bacterial cell concentration (∗), and number of bacterial cells per dinoflagellate cell (•) are shown. Arrows indicate the points at which washing was conducted. Drops in dinoflagellate cell concentration at these points correspond to dilution after washing.

