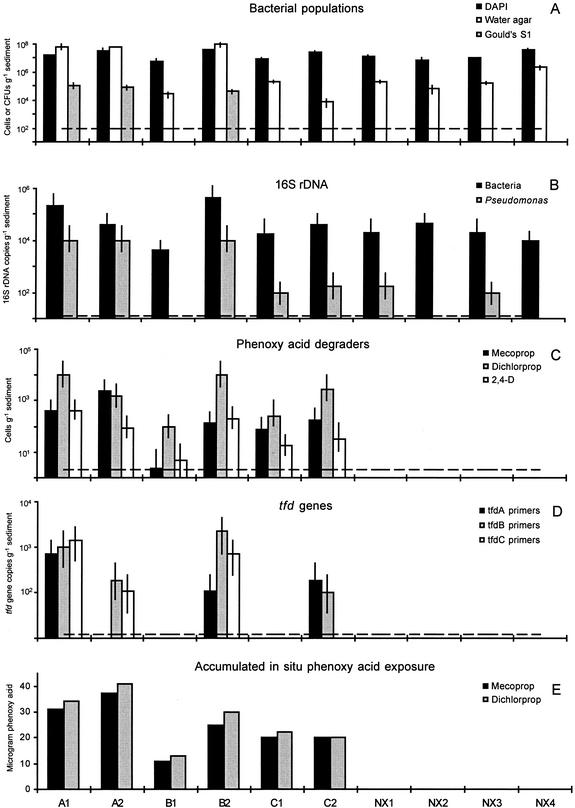
FIG. 3.
Effect of in situ herbicide exposure on microbial community composition in the Vejen aquifer. A1, A2, B1, B2, C1, and C2 indicate sediment samples collected within the herbicide-exposed area of the aquifer, while NX1 to -4 indicate samples collected outside the contaminant plume. Field samples were collected in the saturated zone at two depths (1 = upper, 2 = lower) (see also Materials and Methods). (A) Bacterial population density estimated by DAPI staining (cells per gram of sediment) and by plating on water and Gould's S1 agar (CFU per gram of sediment). Each data point represents the means ± standard deviations of nine replicate measurements. The broken line indicates the detection limit (102 CFU g−1) for culturable estimates. (B) Abundance of Bacteria- and Pseudomonas-specific 16S rDNA gene segments determined by MPN-PCR. Each data point represents the mean ± 95% confidence interval of three replicate measurements. The broken line indicates the detection limit (40 gene copies g−1, assuming that one gene copy can give rise to a PCR product). (C) Population density of phenoxy acid degraders as measured by an MPN assay relying on herbicide degradation. Each data point represents the mean ± 95% confidence interval of five replicate measurements. The broken line indicates the detection limit (2 cells g−1). (D) Abundance of tfd genes determined by MPN-PCR. Each data point represents the mean ± 95% confidence interval of three replicate measurements. The broken line indicates the detection limit (40 gene copies g−1, assuming that one gene copy can give rise to a PCR product). (E) Accumulated exposure levels of mecoprop and dichlorprop in the Vejen aquifer during the in situ natural field injection (reprinted from reference 38 with permission of the publisher).

