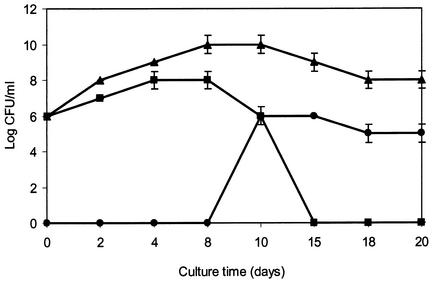
FIG. 5.
Viable counts of F. tularensis cultured alone (squares), F. tularensis cocultured with A. castellanii (triangles), and intracellular F. tularensis (circles). Mean values from two independent experiments are shown (t test, P < 0.05). Bars show averages of the absolute deviations of data points from their mean.

