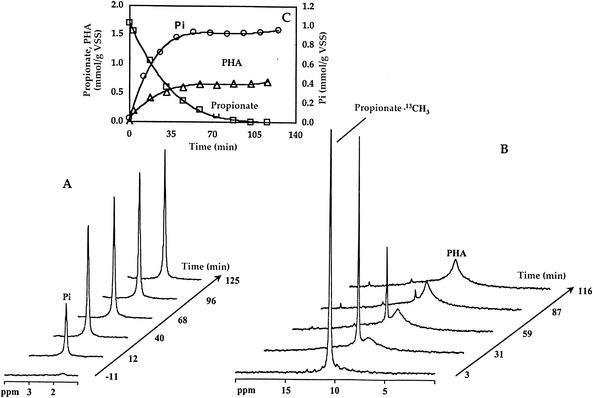
FIG. 3.
Time evolution of phosphorus release (A) and propionate consumption and PHA formation (B) for activated sludge in anaerobic conditions, followed by in vivo 31P-NMR and 13C-NMR. The results obtained are presented in the inset graphic (C). ○, inorganic phosphate (Pi); □, propionate; and ▵, PHA. VSS, volatile suspended solids.

