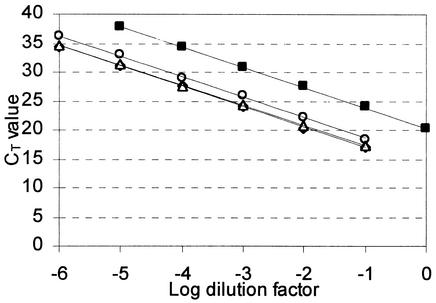
FIG. 1.
Evaluation of amplification efficiency and range of dynamic amplification of the attB-, attP-, attL-, and chr-specific DNA templates. The mean CT values of attB (▪), attP (○), attL (▵), and chr (⧫) from three serial log10 dilutions of DNA extracted in the early stationary phase during growth of the φLC3 lysogenic L. lactis IMN-C1814 were used to construct standard curves. Note that the symbols for the chr and attL data overlap.

