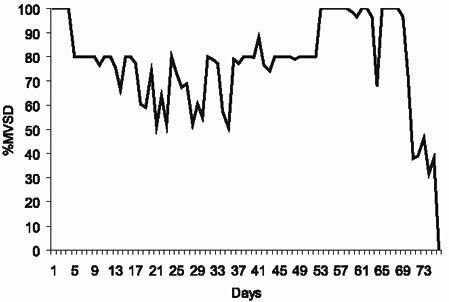
Fig. 2 The wean curve of a patient whose relationship between time and the percentage of mechanical ventilation support per day (%MVSD) conformed significantly only to a negative cubic regression, or curvilinear with 2 curves. This patient experienced a wean turning point (WTP) on day 64 of the hospital course, followed by a relatively brief weaning plateau (5 days) before a 2nd rapid weaning phase led to the discontinuation of mechanical ventilation.
