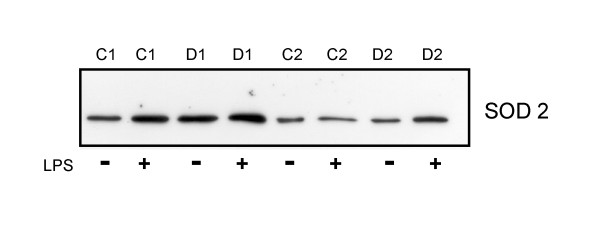
Figure 3.
SOD 2 in LPS-stimulated T1D and control monocytes. Monocytes from four different controls (C1 to C4) and four different T1D patients (D1 to D4) were cultivated with or without LPS for 24 h. SOD 2 was determined by immunoblot and a representative immunoblot from control 1 and 2 (C1, C2) and T1D patient 1 and 2 (D1, D2) is shown.

