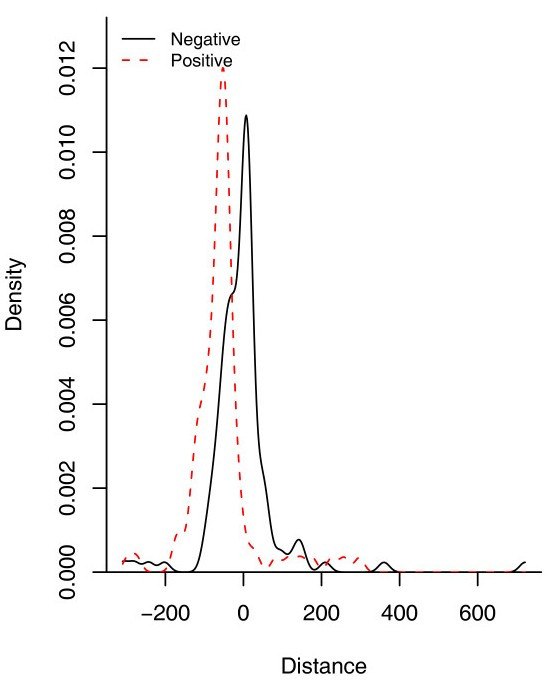
Figure 2.

Distribution of DNA-binding sites in B. subtilis for repressors and activators. Data was retrieved from DBTBS [6]. 0 represents the start of transcription site (+1). The data was fitted using a Gaussian kernelwith a bandwidth of 13.92 for repressor sites and12.42 for activator sites using the density estimation function in the R statistics package.
