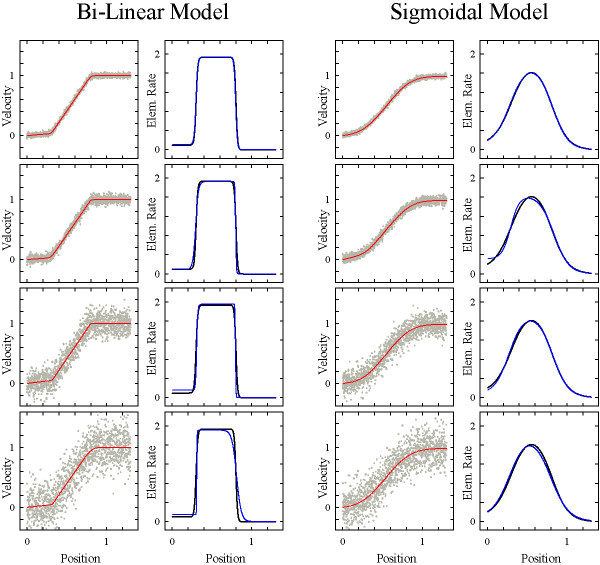
Figure 5.
Effects of noise on fitting the step-stool function Increasing levels of Gaussian noise (from top to bottom) were added to a strongly bi-linear (left; b1 = 0.1, b2 = 1.84, c1 = 0.3, c2 = 0.8, d1 = d2 = 50) and a strongly sigmoidal (right; b1 = 0.1, b2 = 1.84, c1 = 0.3, c2 = 0.8, d1 = d2 = 5) model velocity profile to create "Monte-Carlo-datasets" (gray dots; n = 1301). A person unaware of the nature of this study produced "smart guesses" of coefficient values for the 50% noise level versions of both models (bottom), which were used to initiate the fitting for all of the noise levels; the fitted curves are shown in red. Derivatives (elemental elongation rate profiles) are given on the right of the corresponding velocity profile. Fitted profiles (blue) are practically identical with those expected (black).

