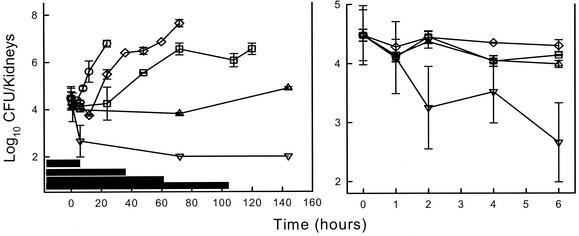
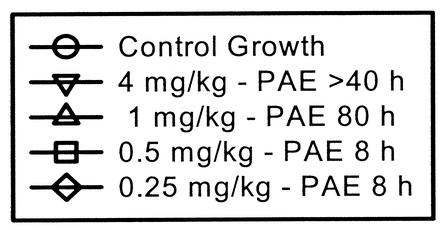
FIG. 2.
(Left panel) In vivo PAE following HMR 3270 doses of 0.25, 0.5, 1, and 4 mg/kg against C. albicans K-1 in neutropenic infected mice. Each symbol represents the mean ± standard deviation (error bars) for two mice. The widths of the horizontal bars represent the time that serum levels exceeded the MIC. (Right panel) In vivo time kill following HMR 3270 doses of 0.25, 0.5, 1, and 4 mg/kg against C. albicans K-1 in neutropenic infected mice. Each symbol represents the mean ± standard deviation (error bars) for two mice.


