
FIGURE 2.
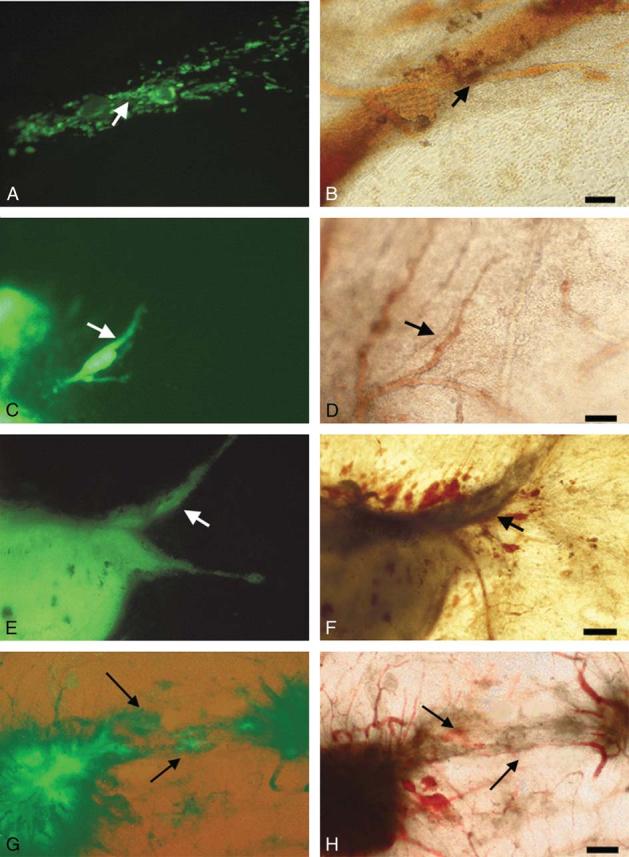
Migration and growth of GFP C8161 human melanoma cells on the chick CAM over a 10-day interval. A, C, E, and G demonstrate fluorescence microscopy, and B, D, F, and H demonstrate corresponding fields with conventional microscopy. A and B, 3 days after inoculation. Melanoma cells (fluorescent in A) are observed spreading along or in the immediate proximity of vessels (arrows), exhibiting a primary angiotropism. Bar = 25 μm. C and D, 6 days after inoculation. Melanoma cells begin to form a tumor mass, and some tumor cells clearly spread along the external surface of a vessel (arrows in C and D), occupying a pericytelike location. Bar = 50 μm. E and F, 10 days after inoculation. A tumor mass has developed at the site of injection, entrapping progressively portions of vessels on which it has grown. Around the tumor, observable vessels are cuffed by tumor cells (arrows). Bar = 50 μm. G and H, 10 days after inoculation. Two tumor masses are linked by vessels. The vessels (arrow in H) are progressively entrapped by tumor cells (arrow in G) growing along these vessels. Bar = 100 μm.