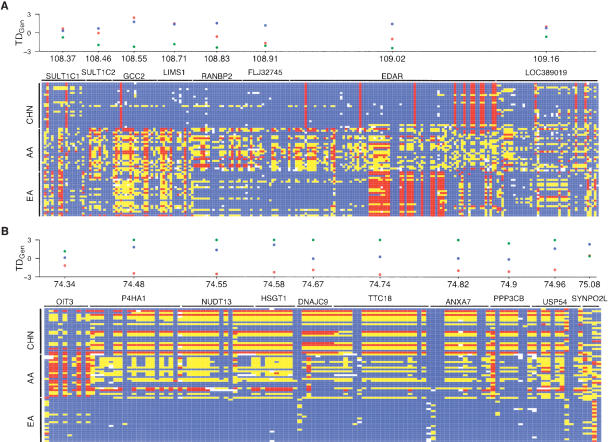
Figure 4.
Strong signatures of positive selection that extend over large genomic regions. Patterns of polymorphism from the two largest clusters of candidate selection genes are shown in A and B. The regions shown in A and B are located on chromosomes 2 and 10, respectively. The signature of selection extends for >500 kb in both regions. In each panel, a graphical representation of genotypes is shown for the AA, CHN, and EA samples. Rows correspond to individuals and columns denote SNPs. For each SNP, blue, yellow, and red boxes indicate whether the individual is homozygous for the common allele, heterozygous, or homozygous for the rare allele, respectively. White boxes indicate missing data. Horizontal black bars denote the location of each gene. The distribution of TDGen for each gene is shown above the graphical representation of genotypes and the chromosomal position in Mb is shown on the x-axis (not drawn to scale). Blue, green, and red circles denote AA, CHN, and EA samples, respectively. Genes located immediately upstream and downstream of the region where patterns of polymorphism begin to approach neutrality are also shown, which helps to demark the signature of selection. Note that in A, the gene MGC10701 (Entrez gene symbol) (located between GCC2 and LIMS1) does not have genotype data available in all three samples and is not included in the figure. Similarly, in B the genes MRPS16 (located between DNAJC9 and TTC18) and ZMYND17 (located between ANXA7 and PPP3CB) are not shown, as they do not contain genotype data in all three samples. For both regions, an excess of low frequency alleles is also observed between genes (data not shown).

