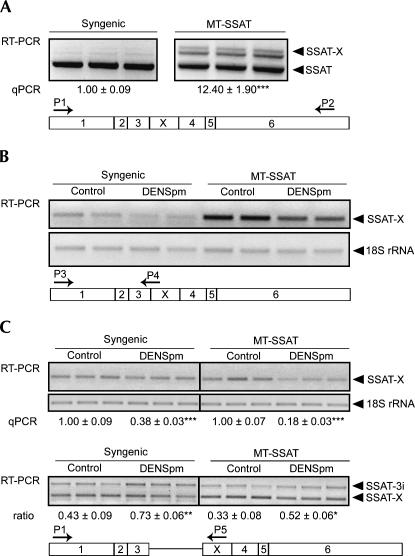
FIGURE 1.
Expression of SSAT transcripts. (A) RT-PCR from the livers of syngenic and MT-SSAT transgenic mice showing both SSAT and SSAT-X (P1/P2). Note that in order to detect SSAT-X, PCR cycles used for syngenic and transgenic samples were 35 and 30, respectively. Also note that the RT-PCR pictures in (A) are not quantitative due to saturation of PCR reaction. The middle-sized product contained both SSAT-X and SSAT as verified by sequencing, and thus was formed during PCR reaction. (B) Cytoplasmic RNA fractions. SSAT-X-specific RT-PCR (P3/P4) from syngenic and MT-SSAT transgenic fetal fibroblasts treated with or without 10 μM DENSpm for 24 h. (C) Nuclear RNA fractions. Cells were treated with or without 10 μM DENSpm for 7 h. (Upper panel) SSAT-X-specific RT-PCR (P3/P4). (Lower panel) exon X-containing transcripts (SSAT-X and intron 3-containing transcript (SSAT-3i) (P1/P5). The ratio of SSAT-3i/SSAT-X was quantified by densitometry. Lanes represent individual samples. 18S rRNA was used as a control. The relative amount of SSAT-X (normalized to total SSAT mRNA) was quantified by quantitative RT-PCR (qPCR). n = 3 ± SD, analyzed in triplicate.

