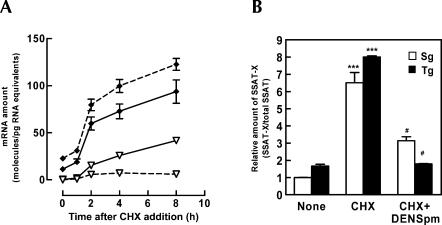
FIGURE 4.
(A) Kinetics of SSAT and SSAT-X mRNA accumulation after inhibition of protein synthesis. MT-SSAT transgenic fetal fibroblasts were treated with CHX (10 μg/mL) and 10 μM DENSpm (added 24 h before CHX) (broken line) or with CHX only (solid line). The amount of SSAT (♦) and SSAT-X (▽) mRNA was quantified with qPCR. 18S rRNA was used as control. Values are means ± SD (n = 3, analyzed in duplicate). (B) The cells were exposed to CHX (10 μg/mL) for 8 h with or without 10 μM DENSpm (added 1 h after CHX). The relative amount of SSAT-X (SSAT-X/total SSAT) was quantified with qPCR. Values are means ± SD (n = 3, analyzed in duplicate). ***p < 0.001 compared to untreated control group, #p < 0.001 compared to CHX group.

