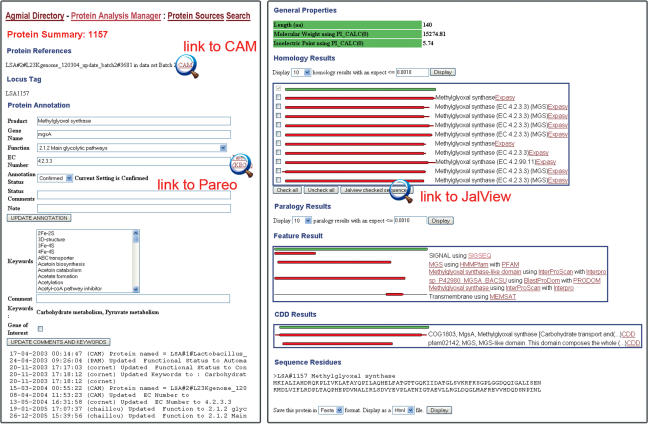
Figure 2.
The right part of the figure shows the results of the different bioinformatic methods applied to the sequence of MgsA. Not all result sections are shown here. In the ‘homology’ section, checking the boxes on the left of the homologous sequences and then clicking on the link to Jalview, below, will show the multiple alignment of the selected sequences and the corresponding phylogenetic tree. The left part of the figure shows the annotation window where the protein annotation is performed. Information entered in this section is forwarded to CAM, the system always makes sure that both managers are synchronized. The bottom of this window shows the annotation history. The link to CAM at the top will lead the annotator back to the CAM interface (MuGeN interface, see Figure 1). The link to PAREO (our relational version of the KEGG database) near the ‘EC number’ box will lead the user to the KEGG interface shown in Figure 3.

