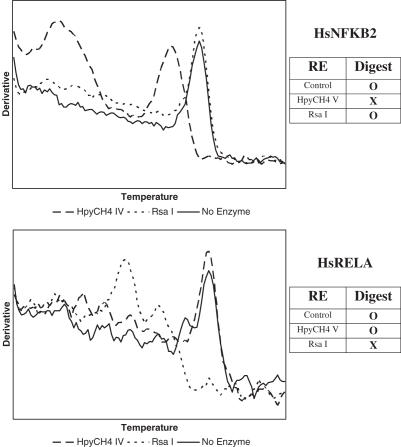
Figure 2.
Verification of Amplicon Specificity using Restriction Enzymes (VASRE) on two real-time PCR amplicons. Expected digestion patterns are shown in the panels on the right. Dissociation curves after digestion with HpyCH4V and RsaI confirm the specificity of two amplicons when compared to expected results.

