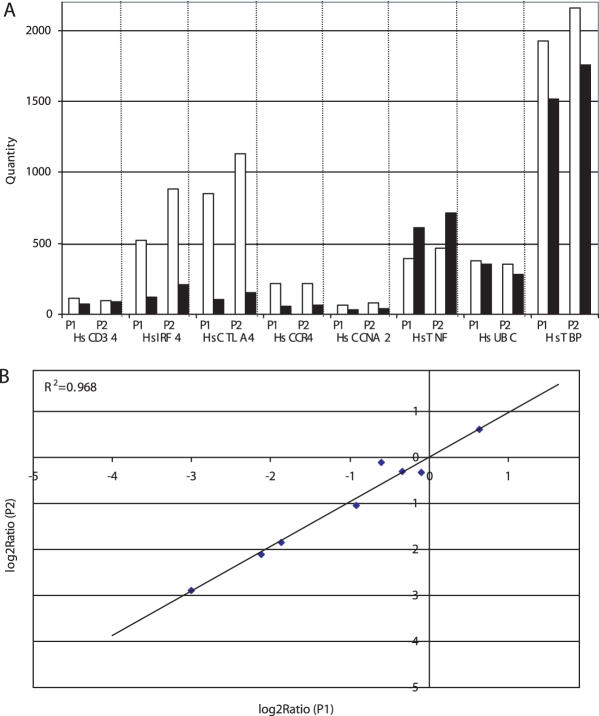
Figure 4.
Assessment of gene transcript copy number using different real-time PCR targets. Expression level of eight genes was determined in CD4+ (open) and CD8+ (closed) T cells by amplification of two target sites in each gene. Absolute quantity was assessed in 1 ng of cDNA from each type of T cell. (A) The graph shows the quantity determined with each primer pair (P1 versus P2). (B) The correlation (0.968) between Log2 Ratio (CD8+/CD4+) for the two sets of primers is shown.

