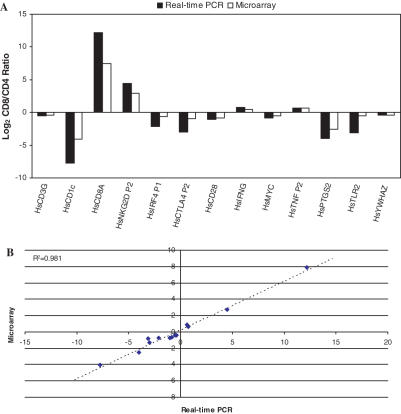
Figure 5.
Validation of microarray data using real-time PCR with a gDNA standard. (A) Ratio of gene expression between CD4+ and CD8+ T cells as assessed by real-time PCR (closed) or Affymetrix Microarray (open). (B) Comparison of Log2 Ratios for each gene. The slope of the regression line (R2 = 0.981) is 0.59 indicating that microarray values are ∼60% of those seen by real-time PCR.

