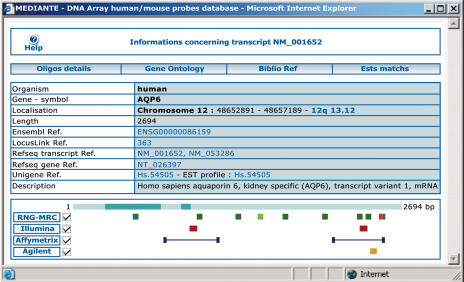
Figure 5.
MEDIANTE screenshot of the summary data for transcript NM_001652. The different exons of each transcript are represented by dark and light blue boxes. The RNG/MRC probes are represented on the first line; the light green box indicates the ‘current optimal probe’. The red box indicates the RNG/MRC probe(s). The blue box indicates a probe selected for a local microarray production. Each set of probes is represented on a distinct line. Affymetrix probe sets are represented by their first and last 25-mer perfect match probes. Additional information about the transcript or probes, such as gene chromosomal location, probe specificity, etc. are provided as clickable links. Subforms provide information about Gene Ontology annotations, bibliographic references or tissue-specificity.

