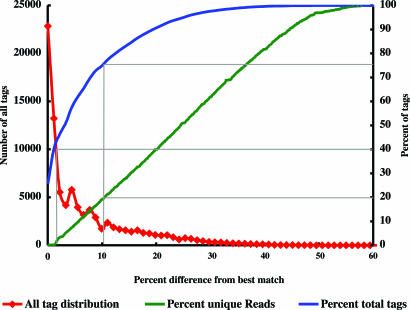
Fig. 3.
Similarity of 454 sequence tags from FS396 to the V6RefDB database. “All tag distribution” plots the number of tag sequences for all samples versus the percentage difference from the best-matching sequence in V6RefDB. “Percent unique reads” from all samples shows the percentage difference between each distinct tag sequence and its best match in V6RefDB. “Percent total tags” plots the cumulative percentage of reads in all samples at or below a given percentage difference from best matches in V6RefDB.

