
Figure 11.
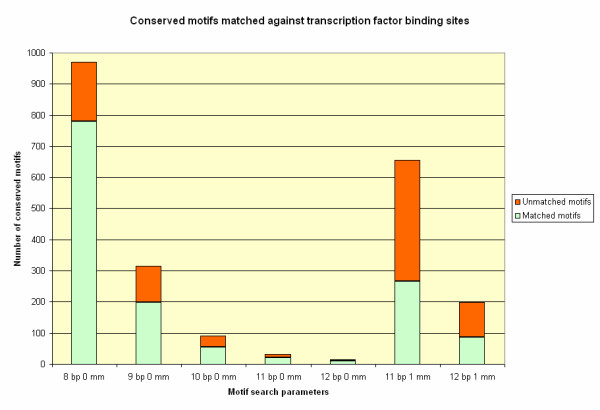
Promoter analysis results with different parameter specifications. Different numbers of conserved DNA sequence motifs found by the promoter analysis algorithm when different parameters were specified (x-axis: length in basepairs [bp]; number of mismatches allowed [mm]). Numbers of conserved motifs (Y-axis) that match known transcription factor binding sites are shown in green, with motifs that do not match known sites shown in orange.