
Figure 4.
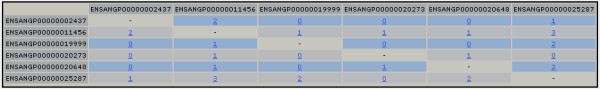
Promoter comparison matrix. Each transcript in the current gene set is displayed in a matrix indicating the number of conserved motifs found between each transcript when compared pair-wise with every other transcript within the gene set. The matrix shown corresponds to the prophenoloxidase case study gene set, with the promoter regions of the six transcripts being compared to search for conserved DNA sequence motifs that are 12 nucleotides in length, with no mismatched bases allowed. Each link in the matrix invokes the sequence comparison output shown in Figure 5.