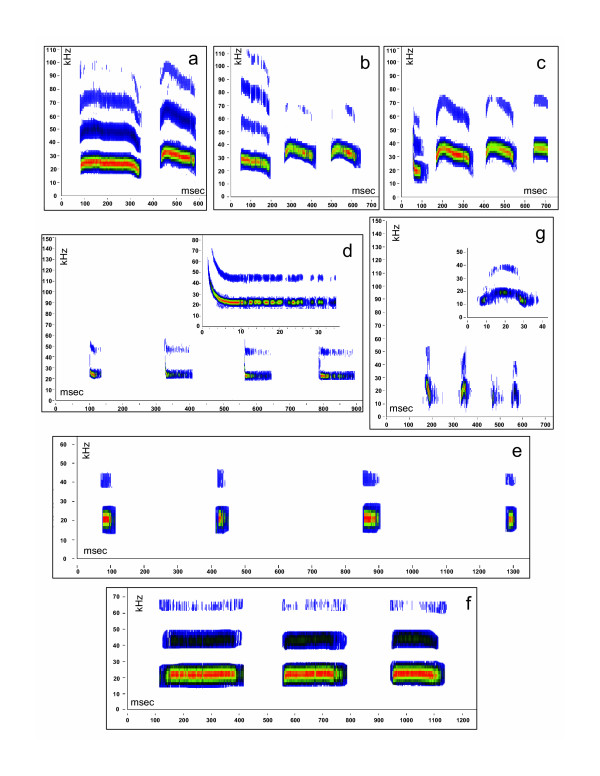
Figure 1.
Spectrograms of the seven Peromyscus motifs. Characteristic spectrograms [frequency (kHz) vs. time (ms) graphs] of the 7 motifs. Amplitude levels are denoted by color with the highest being red and the lowest being blue. All panels reflect whole phrases recorded; a) two part whistle (2PW), b) three part whistle (3PW), c) four part whistle (4PW), d) frequency modulated short 20 (FMS20), e) short 20 (S20), f) long 20 (L20), g) BARK. The insets on the frequency modulated short 20 and the bark motifs are single syllables from the spectrogram, expanded on the x-axis, to show defining detail. For quantitative details of syllables, see text and descriptive statistics in additional file 10. For this figure, background noise has been removed from spectrograms to enhance the clarity of the syllables. To hear original recordings of each panel, listen to additional files 1 through 7.

