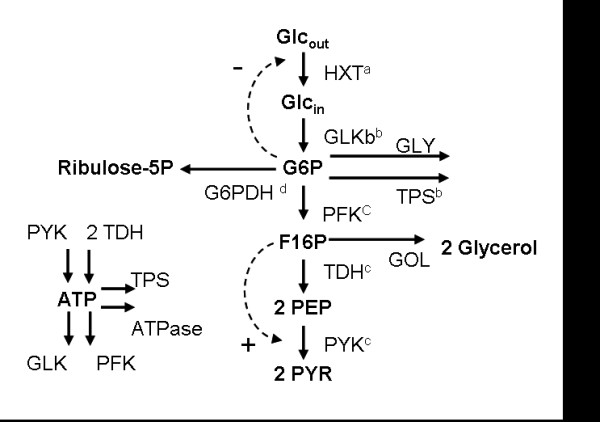
Figure 1.

Scheme of the modelled pathways and ranges used for generation of the in silico GEPs. Our model includes the core of the glycolytic pathway and the first step of the pentose phosphate pathway, It also accounts for the synthesis of glycogen, trehalose and glycerol. Glcout: Extracellular Glucose; Glcin: Intracellular Glucose; G6P: Glucose-6-phosphate; F16P: Fructose-1,6-biphosphate; PEP: Phosphoenolpyruvate; PYR: Pyruvate; HXT: Hexose transporters (HXT1–4, HXT6–8, HXT12); GLK: Glucokinase/Hexokinase (GLK1, HXK1, HXK2); PFK: Phosphofructokinase (PFK1, PFK2); TDH: Glyceraldehyde-3-phosphate dehydrogenase (TDH1, TDH2, TDH3); PYK: Pyruvate kynase (PYK1, PYK2); GLY: Production glycogen; TPS: Trehalose 6-phosphate syntase complex (TPS1, TPS2, TPS3); G6PDH: Glucose 6-phosphate dehydrogenase (ZWF1). Range of fold changes expression explored in the simulations: (a) Gene allowed to increase its expression by up to ten times its basal level; 10 uniformly spaced samples. (b) Gene allowed increasing its expression by up to nineteen times its basal level; 13 uniformly spaced samples (c) Gene expression allowed to change between ¼ and four times the basal value; 7 samples taken, at levels of expression that are 4×, 3×, 2×, 1×, 1/2×, 1/3× and 1/4× that of its basal level. (d) Gene allowed increasing its expression by up to eight times its basal level; 8 uniformly spaced samples.
