Figure 6.

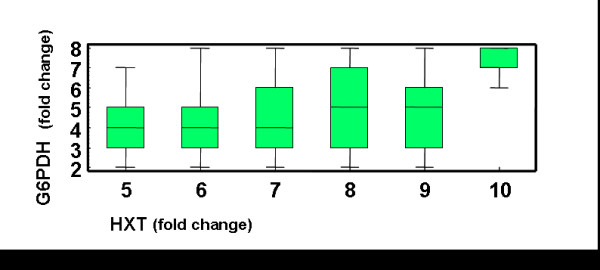
G6PDH and HXT over-expression. Box and whisker plots (see Fig.5 legend for further details) showing the joint distribution of the changes in the expression of G6PDH and HXT in the GEPs that fulfil all the performance criteria.

G6PDH and HXT over-expression. Box and whisker plots (see Fig.5 legend for further details) showing the joint distribution of the changes in the expression of G6PDH and HXT in the GEPs that fulfil all the performance criteria.