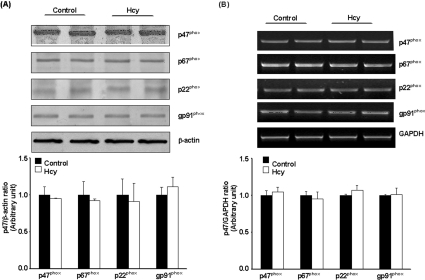
Figure 4. NADPH oxidase subunit protein and mRNA levels in monocytes.
Cells were incubated for 30 min in the absence (Control) or presence of Hcy (100 μM). (A) Cellular extracts were prepared and the protein levels of p47phox, p67phox, p22phox and gp91phox were determined by Western-blot analysis. β-Actin was used to confirm equal amount of protein loading for each sample. (B) Total mRNA was isolated and the mRNA levels of individual NADPH oxidase subunits were analysed by RT–PCR. GAPDH mRNA was used as an internal standard to verify equal PCR product loading for each experiment. Representative photos were obtained from three separate experiments. Results are expressed as means±S.E.M.

