
Fig. 8.
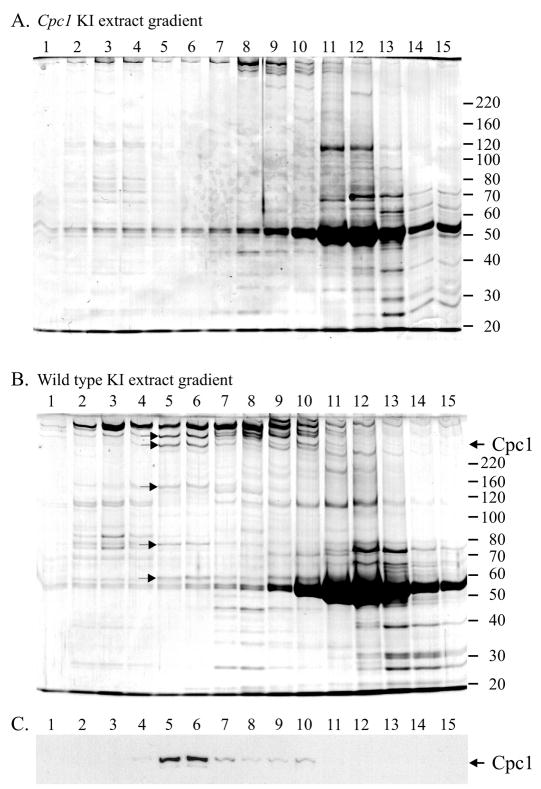
Sucrose density gradient analysis of KI extracts from Chlamydomonas axonemes. (A,B) cpc1 axonemes (A) and wild-type axonemes (B) were sedimented on 5-20% sucrose gradients and resulting fractions were analyzed by SDS-PAGE (bottom of gradient to the left). Gels were stained with Coomassie blue. The sizes of molecular weight standards (in kDa) are shown along the right edge of each gel. (C) Western blotting of gel in (B) with anti-Cpc1A shows that Cpc1 sediments in two peaks with approximate sedimentation coefficients of 16S and 9S. Five proteins [marked in (B) with arrows], including CP3, CP4 (Cpc1) and bands of 135 kDa, 79 kDa, and 56 kDa co-sediment with Cpc1 in the faster sedimenting (16S) peak. None of these bands are seen in KI extracts from cpc1 axonemes (A).