
Figure 6.
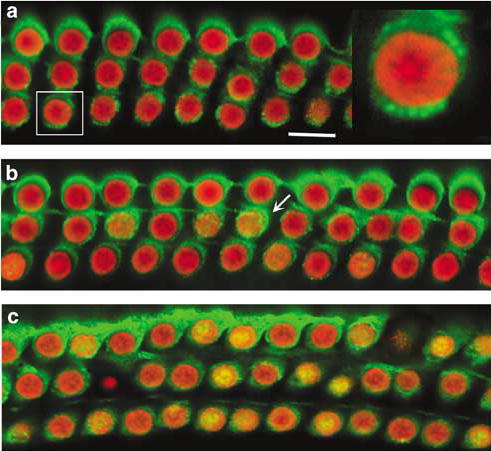
Immunoreaction for EndoG in the cochlea. Surface preparations of the organ of Corti were stained for EndoG (green) and nuclei (PI, red). a: EndoG was located in the cytosol of outer hair cells in saline control animals, and EndoG-like immunoreactivity seemed to be limited to mitochondria (a right, magnified outer hair cell). b: At the 7th day of kanamycin treatment EndoG was still associated with mitochondria of most outer hair cells, but already appeared diffuse in a few cells (b, arrow). c: After kanamycin for 11 days, EndoG was translocated into the nuclei (c, yellow). This figure is representative of three individual animals at each time point. Scale bar: 10 μm