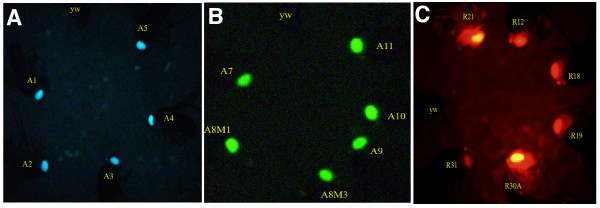
Figure 3.

Comparison of fluorescence intensities of lines carrying insulated and uninsulated marker genes. A representative fly is shown from each of the lines carrying the insulated GMR-3xP3-AmCyan (A) and GMR-3xP3-ZsGreen (B) marker genes. Little variation in fluorescence intensity is seen between lines suggesting position effects had been minimized by the flanking scs and scs' insulator elements. In contrast lines carrying an uninsulated 3xP3-DsRed1 marker gene (C) show considerable variation in fluorescence intensity. Some lines are barely detectable above background fluorescence (y w) while other lines show very strong fluorescence.
