
Figure 2.
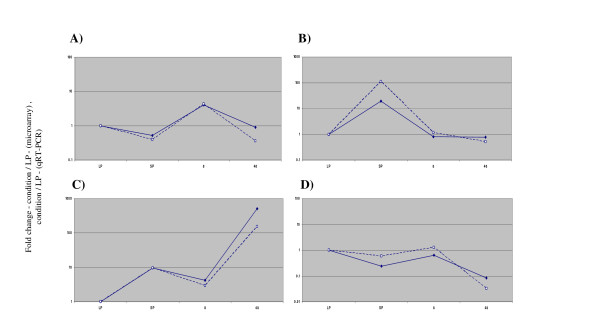
Comparison of microarray and quantitative reverse transcriptase PCR (qRT-PCR) transcription profiles. A) PA0020 (array cluster 8), B) fliE (array cluster 6), C) PA2184 – (array cluster 1), D) PA5555 – (array cluster 4). X-axis labels (expression conditions) – LP, LP planktonic culture; SP, SP planktonic culture; 8, 8 hr biofilm; 48, 48 hr biofilm. Microarray results – unbroken line, qRT-PCR results broken line. For both microarray (average expression value) and qRT-PCR (expression value) results, the value for each condition (SP, 8, and 48) was divided by the value obtained for LP.