
Figure 3.
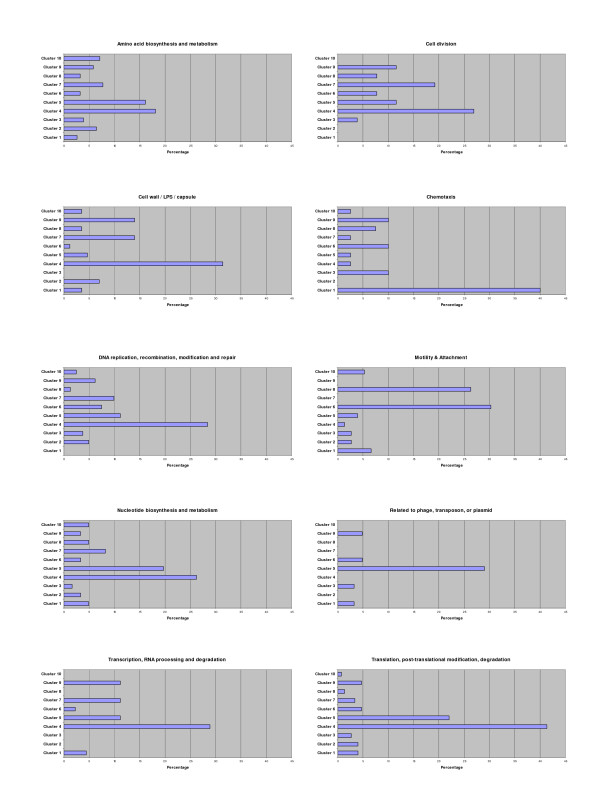
Distribution of ten functional classes throughout the clusters created by K-means clustering (K = 10). Percentages were obtained by dividing the number of genes of a functional class in each cluster, by the total number of genes in that functional class. For a representation of all twenty-six functional classes in all ten clusters see Additional File 1 (Figure. S2).