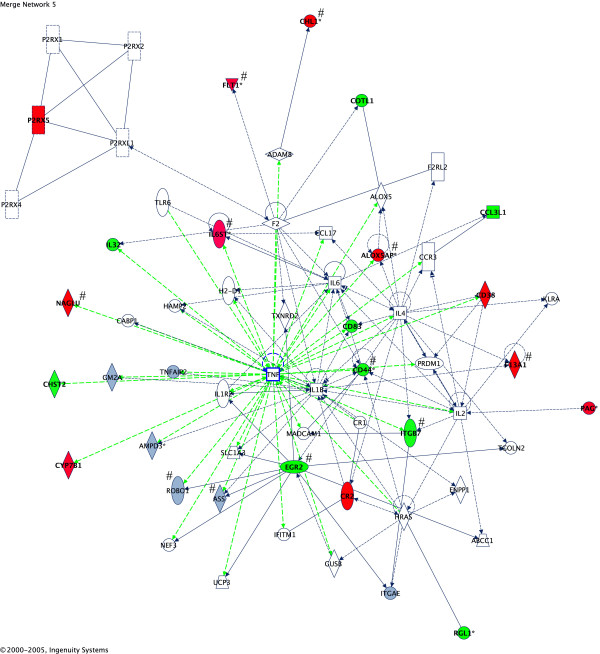
Figure 2.
Gene networks showing inter-relationship between differentially expressed genes in lymphoblastoid cell lines from monozygotic twins discordant in severity of autism spectrum disorder and/or language impairment. The over-expressed (red) and under-expressed (green) genes were identified as significant using SAM analysis (FDR = 15.6%) of microarray data across 5 twin pairs. The log2 expression ratio cutoff was set at ± 0.58 and was based upon the mean values for each gene. Differentially expressed genes within this network that have a reported role in nervous system development and function are marked with a "#" symbol and include: ALOX5AP (FLAP), CD44, CHL1, EGR2, F13A1, FLT1, IL6ST, ITGB7, and NAGLU. Gray genes are present but do not meet expression cutoff.

