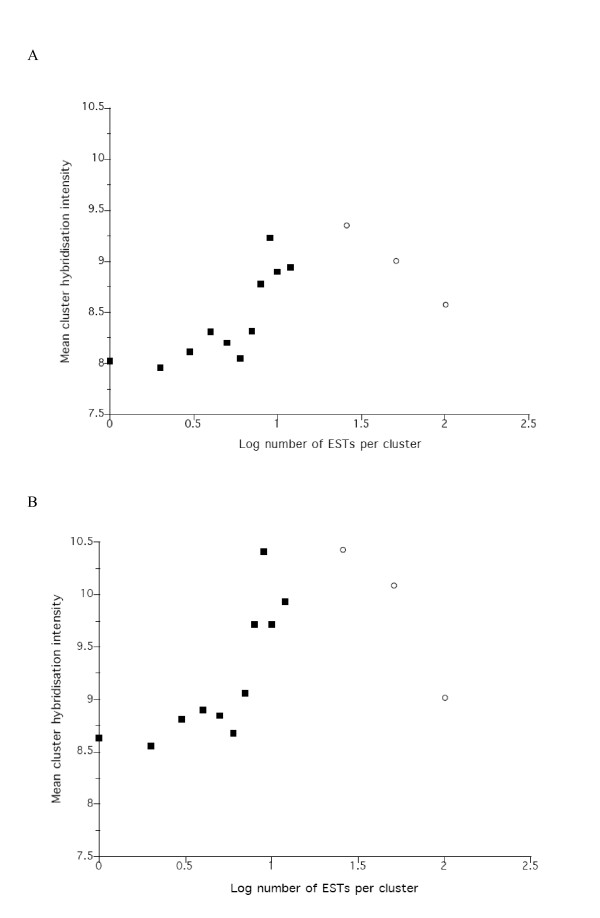
Figure 2.

The relationship between the log number of ESTs within a cluster and the observed mean cluster hybridization intensity for A) L1 and iL3 and B) L2-direct and – indirect microarray hybridization in which clusters containing more than 10 ESTs were grouped into three categories (11–25, 26–50 and > 51, nominally set as 25, 50 and 100, respectively) (○) and one >10 category, nominally set as 11 (■)).
