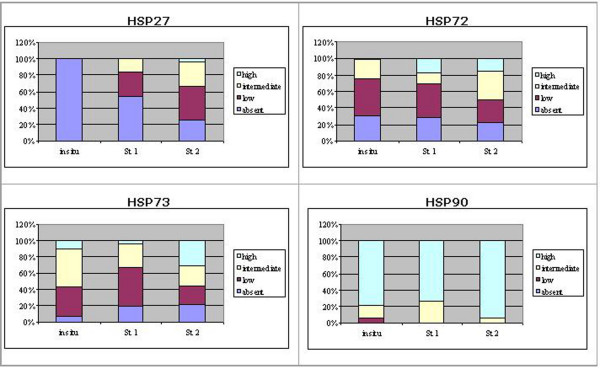
Figure 9.
Comparison of HSP expression among tumour groups. The figure shows the percentage of expression of each Hsp (absent, low, intermediate and high) in in situ and infiltrating malignant tumours, the latter grouped as cases with local stromal invasion (St1) or with intravascular invasion (St2). As far as Hsp27 and Hsp72 expression is concerned, the intermediate and high immunostaining was found to be significantly associated with invasive stages (P < 0.01) (Chi square test). Hsp73 expression did not appear to be correlated to invasion, whereas Hsp90 showed a predominantly high expression in all groups.

