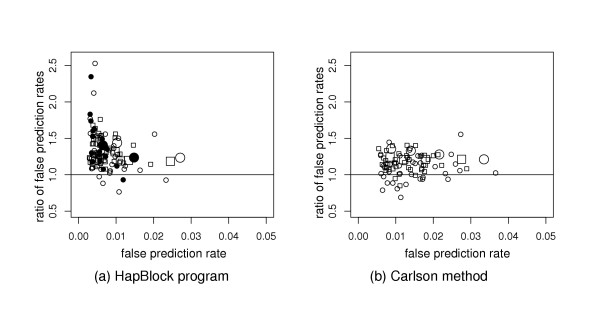
Figure 3.

Comparison with other tag SNP selection algorithms. Performances of tag sets selected with (a) the HapBlock program, or (b) the Carlson method are compared with the performances tag sets of the same sizes selected with the LS-HET model. The horizontal axis reports the false prediction rate associated with the tag sets selected by the HapBlock program or the Carlson method. The vertical axis reports the ratio of this false prediction rate over the false prediction rate associated with the tag set of the same size selected with the LS-HET model. All the predictions are performed by the LS-HET model and the false prediction rates are averaged over the six cross-validation experiments. Each point corresponds to the combination of one data set and one set of user-defined parameters. Large symbols emphasize results obtained on Chromosome 7; circles and rectangles stand for results on CEU and YRI data sets, respectively. (a) For the HapBlock software, (αHB, βHB) are: (0.8, 0.099), (0.9, 0.099), (0.9, 0.049) and (0.95, 0.049) with the diversity criterion for tag SNP selection (open symbols); and (0.8, 0.099) and (0.9, 0.099) with the entropy criterion for tag SNP selection (close symbols). (b) The r2 thresholds for the Carlson method are: 0.35, 0.5, 0.65 and 0.80.
