
Figure 1.
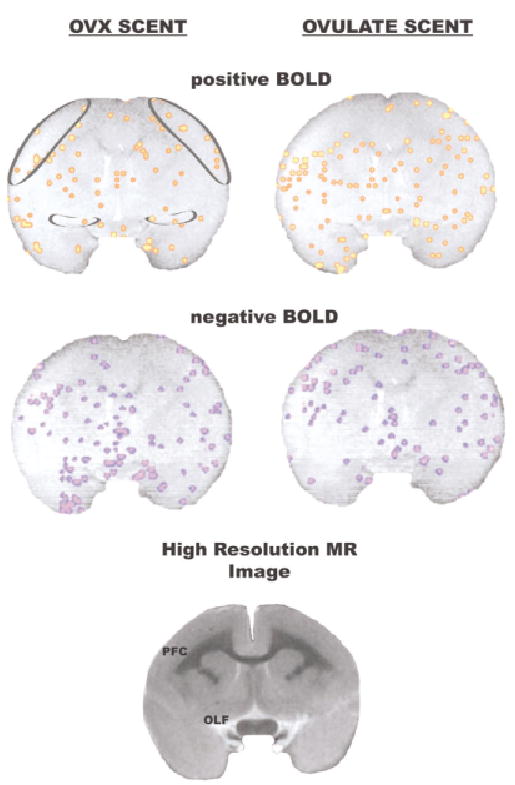
Activational maps at the level of the prefrontal cortex. Significant changes in positive and negative BOLD signal are shown for presentation of OVX scent and ovulatory scent. Rather than show positive and negative BOLD for each scent as a single composite, they are presented individually one above the other, respectively. Regions of interest are shown in the circumscribed areas in the upper right coronal section. These images are taken from a single animal. A high-resolution image taken from a formalin-fixed marmoset brain is presented to show neuroanatomical detail. Abbreviations: PFC = prefrontal cortex, OLF = olfactory tubercles.