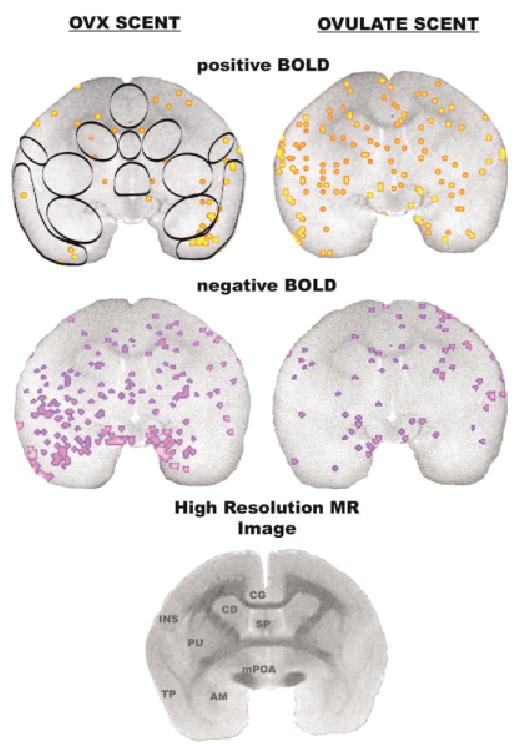
Figure 2.

Activational maps at the level of the amygdala. Images were taken from a single animal. See Fig. 1 for detailed description. Abbreviations: INS = insular cortex, CG = cingulate cortex, CD = caudate, SP = septum, PU = putamen, TP = temporal cortex, AM = amygdala, mPOA = medial preoptic area.
