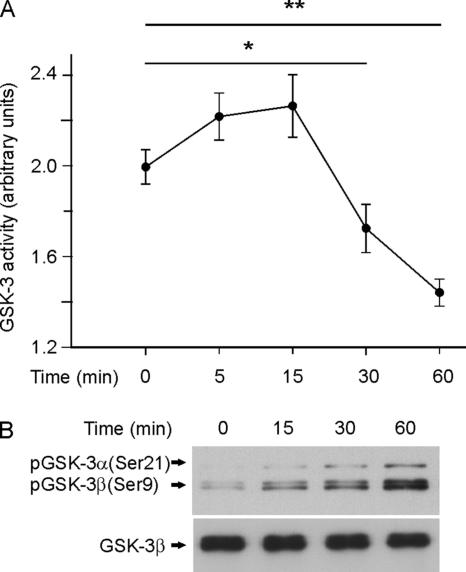
Figure 3.
Time course of NGF-induced inactivation of GSK-3. (A) GSK-3 (α + β) activity was determined in cytosolic extracts from 7 DIV cultures of hippocampal neurons treated with 100 ng/ml NGF for the times reflected in the graph. (B) Western blots analysis of the same extracts with anti-phospho-GSK-3α/β (Ser21/9) (top) and anti-GSK-3β (bottom) antibodies. Note that the inactivation of GSK-3 correlates with the levels of Ser9 phosphorylation.

