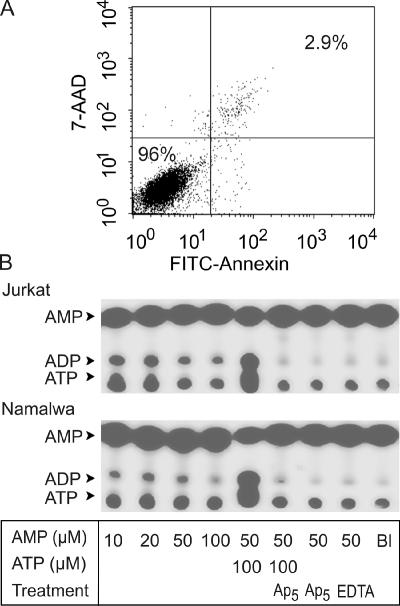
Figure 2.
Pattern of [α-32P]AMP phosphorylation by lymphocytes. (A) Jurkat cells were incubated for 90 min with 100 μM AMP, and their viability was assessed by double staining with a marker of apoptosis annexin V-FITC (abscissa) and cell-impermeable dye 7-AAD (ordinate). The percentages of viable and necrotic cells are shown in the bottom left and top right quadrants of the dot plot graph, respectively. (B) Jurkat (top panel) and Namalwa (bottom panel) were incubated for 50 min with tracer [α-32P]AMP and the indicated concentrations of unlabeled AMP and ATP. Cells were also pretreated with 50 μM Ap5A (Ap5) or 2.5 mM EDTA before addition of nucleotide substrates. Mixture aliquots were spotted onto SIL-G/UV254 plates, separated by TLC, and developed by autoradiography.

